Oscilloscope & Spectrum Analyzer Software
- |
- Automotive
- |
- Data Acquisition
- |
- Electrical
- |
- Environmental
- |
- Food Safety
- |
- Mechanical Measurement
- |
- Multimeters
- |
- Test & Measurement
- |
- Temperature Monitoring
- |
- Test Accessories
- |
- Thermometers
- |
PicoScope is the standard in PC Oscilloscope software, but it is much more than just an oscilloscope.
It's your complete test and measurement lab in one easy-to-use application.
If you buy a traditional oscilloscope, you get an oscilloscope. Buy a traditional spectrum analyzer, you get a spectrum analyzer. Buy a traditional waveform generator, you get a waveform generator. Buy a PicoScope USB Oscilloscope and - thanks to power of PicoScope - you can get an oscilloscope, spectrum analyzer and signal/waveform generator all in one. (With PicoScope's ability to continuously stream data you can even use your oscilloscope for data acquisition.)
Free Updates
You can't usually upgrade traditional test equipment. If the device is upgradable it will often need a time-consuming and expensive trip back to the manufacturer. PicoScope software is regularly updated with feature extensions and improvements. These can be downloaded for free from our website and ensure that your oscilloscope will always have the latest features and enhancements. What other test equipment gets more powerful with age?
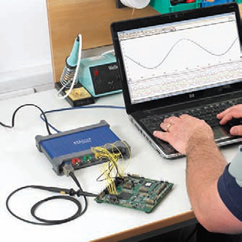
PicoScope at a glance
- 10,000 waveform buffer
- Advanced triggering
- Advanced zoom controls
- Arbitrary waveform generator
- Auto-arrange axes
- Auto setup
- Automated measurements
- AWG editor
- CMD-line file conversions
- Continuous streaming mode
- Custom probes
- Digital persistence mode
- Easy data export
- Equivalent time sampling
- Free updates
- Linear interpolation
- Low–pass filtering
- Mask limit testing
- Math functions
- Rapid trigger mode
- Reference waveforms
- Resolution enhancement
- Serial decoding
- Signal generator
- Sin(x)/x interpolation
- Spectrum Analyser mode
- XY oscilloscope mode
Easy to use
Unrivalled Performance
All This and It's Free
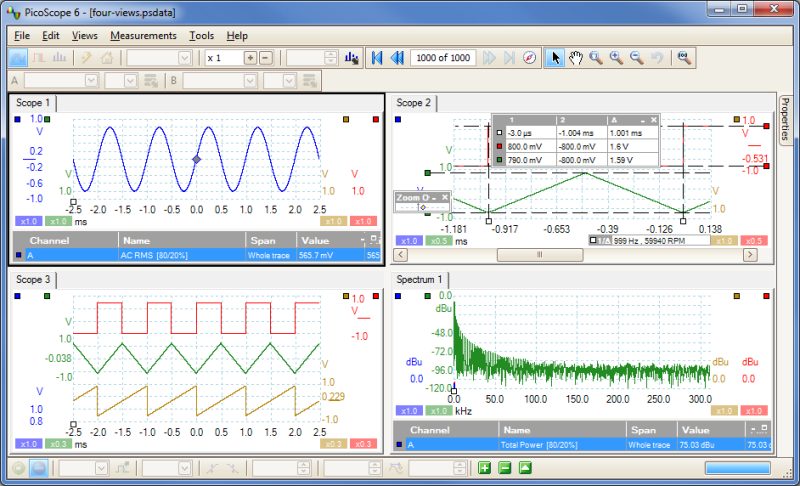
PicoScope
Oscilloscope
Software
Start PicoScope, click Auto setup and your PC is transformed into a powerful oscilloscope with the timebase and triggering already set up. Click Persistence mode and you can emulate the phosphor display of a conventional analog scope - useful for displaying complex analog signals and spotting glitches. Click Spectrum mode and your PC becomes an FFT spectrum Analyser. And there's more…
Triggers
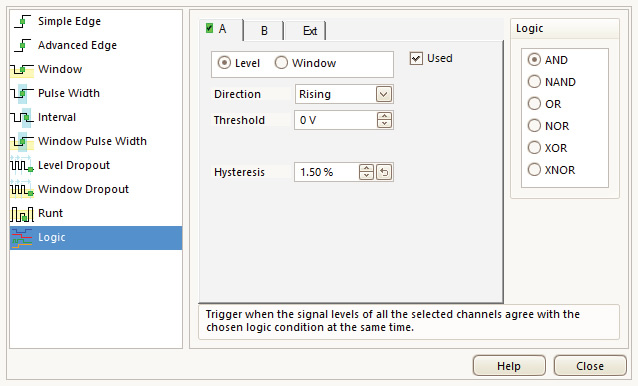
Since 1991 Pico Technology have been pioneering the use of digital triggering and precision hysteresis using the actual digitized data. Traditionally digital oscilloscopes have used an analog trigger architecture based on comparators. This can cause time and amplitude errors that cannot always be calibrated out. The use of comparators often limits the trigger sensitivity at high bandwidths and can also create a long trigger rearm delay.
PicoScopes broke new ground back in 1991 by being the first to use digital triggering. This method reduces errors and allows our oscilloscopes to trigger on the smallest signals, even at the full bandwidth. Trigger levels and hysteresis can be set with high precision and resolution.
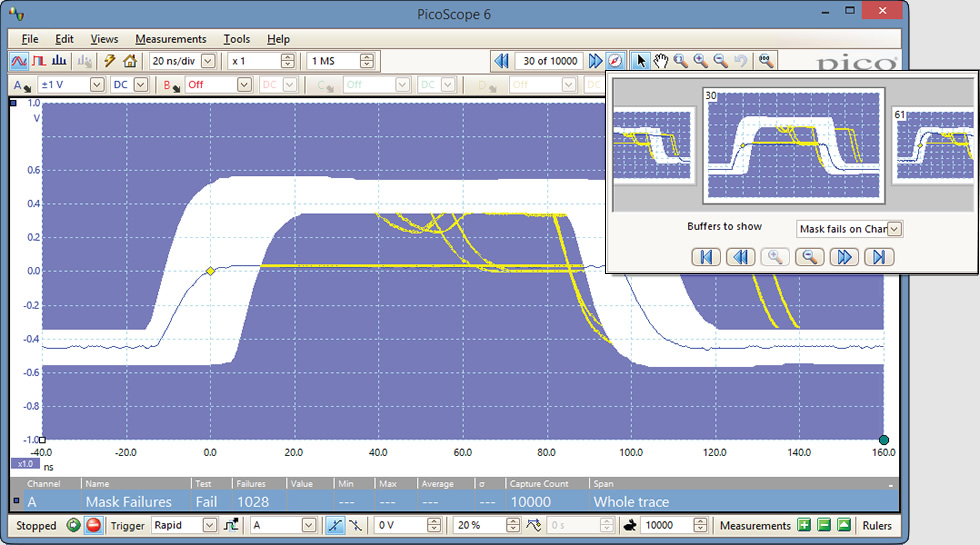
Digital triggering also reduces rearm delay and this, combined with the segmented memory, allows the triggering and capture of events that happen in rapid sequence. At the fastest timebase you can use rapid triggering to collect 10,000 waveforms in under 20 milliseconds. The mask limit testing function can then scan through these waveforms to highlight any failed waveforms for viewing in the waveform buffer.
Spectrum Analyser
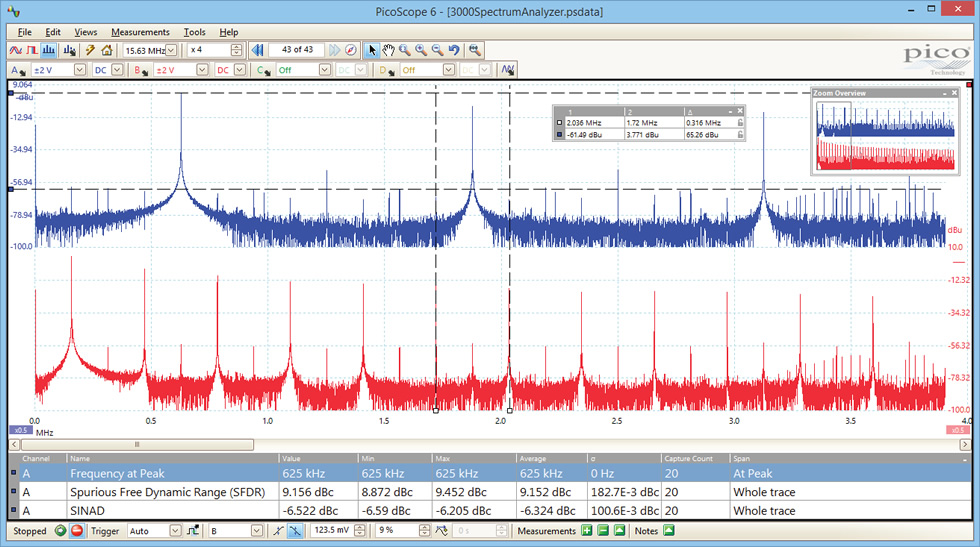
With the click of a button you can display a spectrum plot of selected channels up to the full bandwidth of the oscilloscope. A full range of settings gives you control over the number of spectrum bands, window types, and display modes (instantaneous, average, or peak-hold).
You can display multiple spectrum views with different channel selections and zoom factors, and place these alongside time-domain views of the same data. A comprehensive set of automatic frequency-domain measurements can be added to the display, including THD, THD+N, SNR, SINAD and IMD. You can even use the AWG and spectrum mode together to perform swept scalar network analysis.
Advanced Display
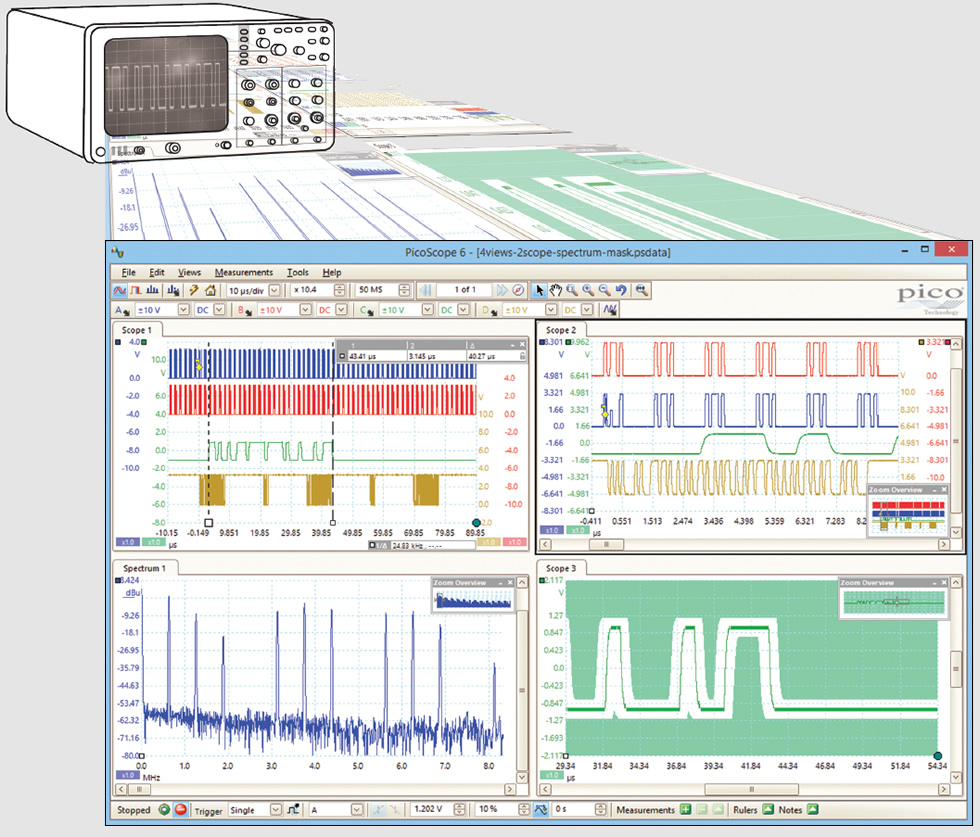
The PicoScope software provides advanced detail and clarity for viewing your signals. The majority of the display area is dedicated to the waveform, ensuring that a huge amount of data can be seen at once. Even with a laptop, the viewing area for a PicoScope USB oscilloscope is far larger than that of a typical benchtop oscilloscope.
Size
The size of the display is only limited by the chosen PC. With a large waveform area available, you can select a customizable split-screen display to view multiple channels or different views of a signal at the same time. The software can even show multiple oscilloscope and spectrum analyzer traces at once.
Resolution
The superior resolution offered by a PC monitor means that even with multiple views or complex signals, no detail will be lost.
Flexibility
Each waveform shown in a customized view works with individual zoom, pan, filter, and measurement tools for ultimate flexibility. The buffer overview function also allows you to quickly find rare, highspeed events in a long capture, ensuring you are always viewing the most relevant data.
Ease of use
The PicoScope software controls are easy to access and use within the large display window. You can clearly read all the settings and data for your waveform.
Colour Persistence Mode
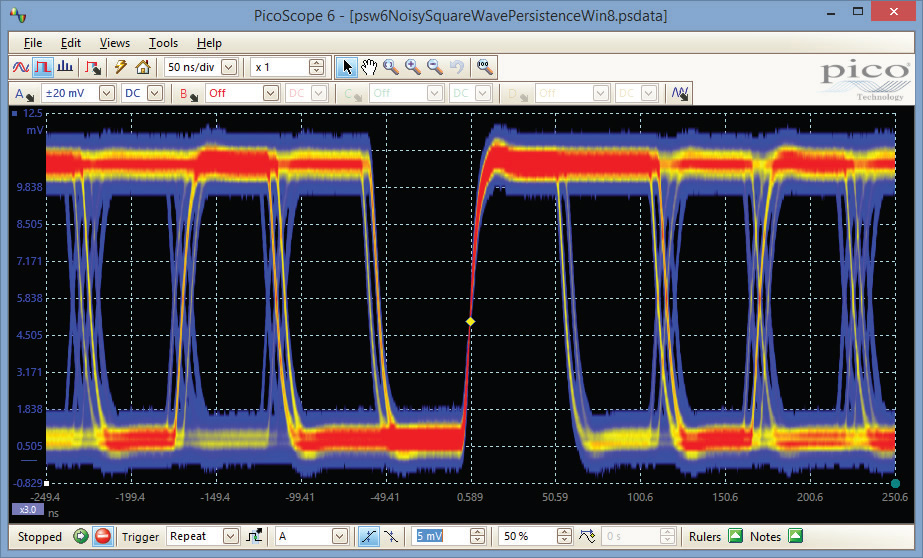
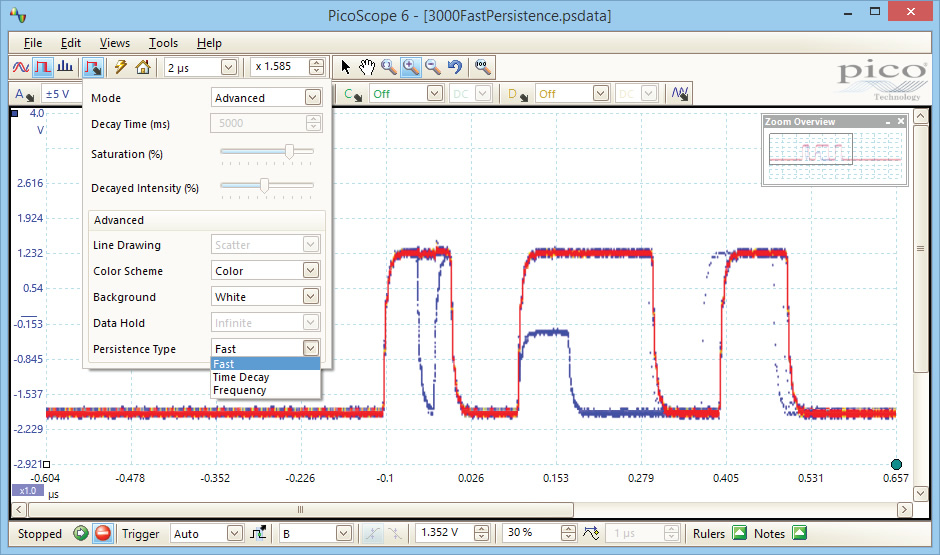
Color Persistence mode allows you to see old and new data superimposed, with new or more frequent data in a brighter color or shade. This makes it easy to see glitches and dropouts and to estimate their relative frequency. Simply click the persistence button and choose between analog intensity, digital color, and fast display modes, or create your own custom rules.
PicoScope's new Fast Persistence mode can collect over 100 000 waveforms per second, overlaying them all with color-coding or intensitygrading to show which areas are stable and which are intermittent. Faults that previously took minutes to find now appear within seconds.
High Speed Data Acquisition and Digitizer
The supplied drivers and software development kit (SDK) allows you to write your own software or interface to popular third-party software packages such as National Instruments LabVIEW and MathWorks MATLAB.
The driver supports data streaming, a mode which captures gap-free continuous data over USB direct to the PC's RAM or hard disk at rates of up to 125 MS/s and capture sizes limited only by available PC storage. Sampling rates in streaming mode are subject to PC specifications and application loading.
Mask Limit Testing
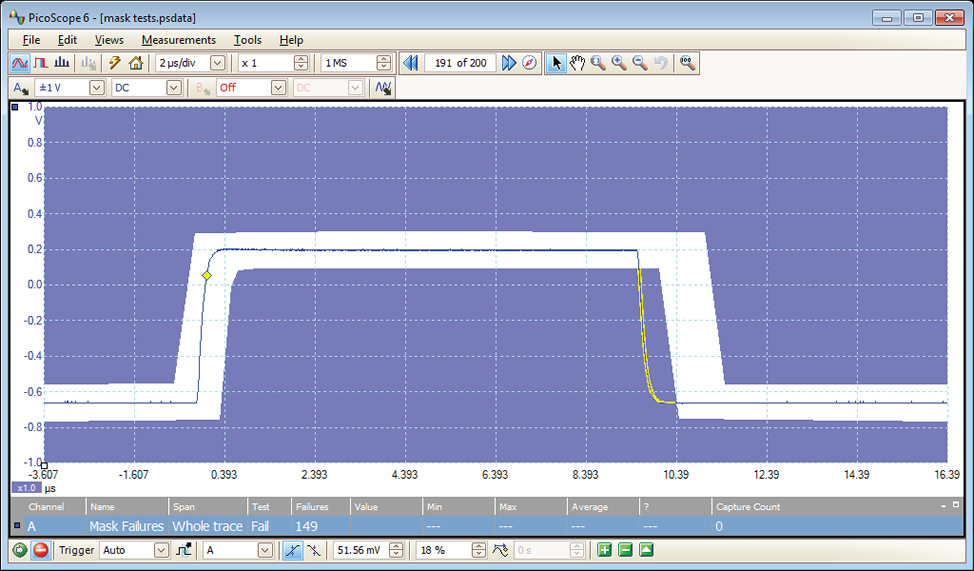
Mask limit testing allows you to compare live signals against known good signals, and is designed for production and debugging environments. Simply capture a known good signal, draw a mask around it, and then attach the system under test. PicoScope will capture any intermittent glitches and can show a failure count and other statistics in the Measurements window.
The numerical and graphical mask editors can be used separately or in combination, allowing you to enter accurate mask specifications, modify existing masks, and import and export masks as files.
Automatic Measurements
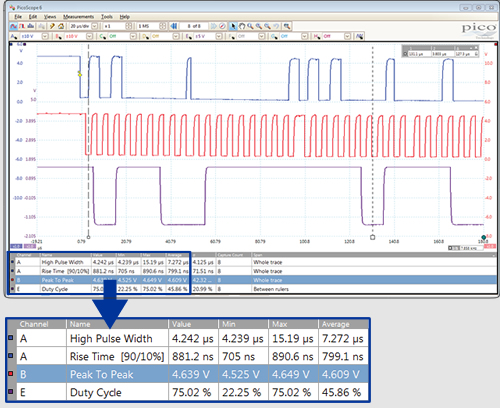
PicoScope allows you to display a table of calculated measurements for troubleshooting and analysis.
Using the built-in measurement statistics you can see the average, standard deviation, maximum and minimum of each measurement as well as the live value. You can add as many measurements as you need on each view.
| Automatic Measurements | |
|---|---|
| Oscilloscope mode | AC RMS, true RMS, cycle time, DC average, duty cycle, falling rate, fall time, frequency, high pulse width, low pulse width, maximum, minimum, peak to peak, rise time, rising rate. |
| Spectrum mode | Frequency at peak, amplitude at peak, average amplitude at peak,total power, THD %, THD dB, THD+N, SFDR, SINAD, SNR, IMD |
| Statistics | Minimum, maximum, average, standard deviation |
Math Channels
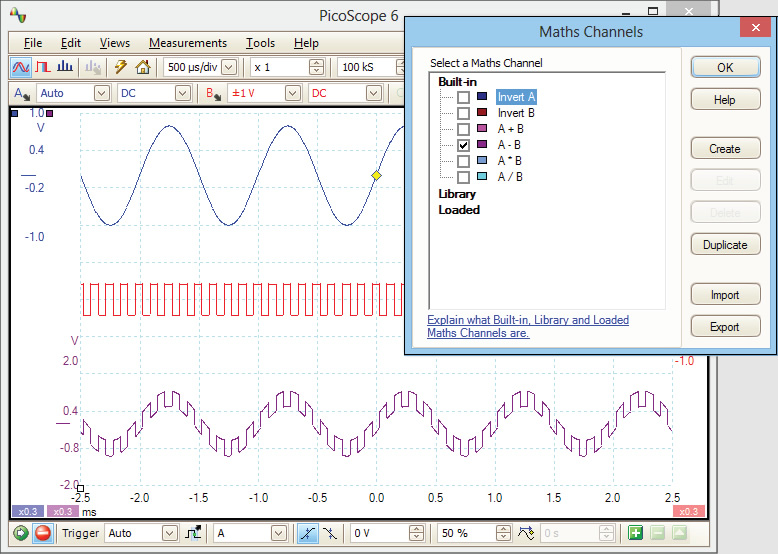
The integrated math functions of PicoScope 6 allow you to perform a variety of mathematical calculations on the input signals of your PicoScope oscilloscope. With the click of a button you can invert, add, subtract, multiply and divide channels, or create your own functions.
To add a math channel, just click a button and a wizard will guide you through the process. You can quickly select one of the built-in functions, such as inversion or addition, or open the equation editor to create complex functions involving filters (low pass, high pass, band pass and band stop filters), trigonometry, exponentials, logarithms, statistics, integrals and derivatives. You can control the entire process using either your mouse or keyboard.
With PicoScope math channels you can display up to eight real or calculated channels in each scope view. If you run out of space, just open another scope view and add more.
DC offset, zero offset, resolution enhancement,
custom probes, and filtering here.
Configures the timebase
and voltage ranges for
stable display of signals.
and differential ruler
measurements are listed here.
full analog-domain controls, including
zoom, filtering, and signal generator,
are all available in MSO digital signal mode.
time-correlated with digital inputs.
and then display as an analog level.
as groups in numerical or ASCII format.
| Item | Minimum Specification | Recommended Specification |
|---|---|---|
| Operating System |
Windows XP (SP3) Windows Vista Windows 7 Windows 8 (not Windows RT) Beta software: Linux Debian, OpenSUSE and Fedora derived distributions, OS X (Mac). |
|
| 32- and 64-bit versions supported | ||
| Processor | 1 GHz | 1 GHz |
| Memory | 512 MiB | 512 MiB |
| Free disk space# | 32-bit: 600 MB 64-bit: 1.5 GB | 32-bit: 850 MB 64-bit: 2 GB |
| Ports | USB 2.0 compliant port | USB 2.0 or 3.0 compliant port |
| # The PicoScope software does not use all the disk space specified in the table. The free space is required to make Windows run efficiently. | ||
